Rank #5 of 6 in Observability & Monitoring

Install
npm install -g @datadog/datadog-ci vs Grafana
 vs Sentry
 vs New Relic
 vs Honeycomb
 vs SigNoz
Showcase
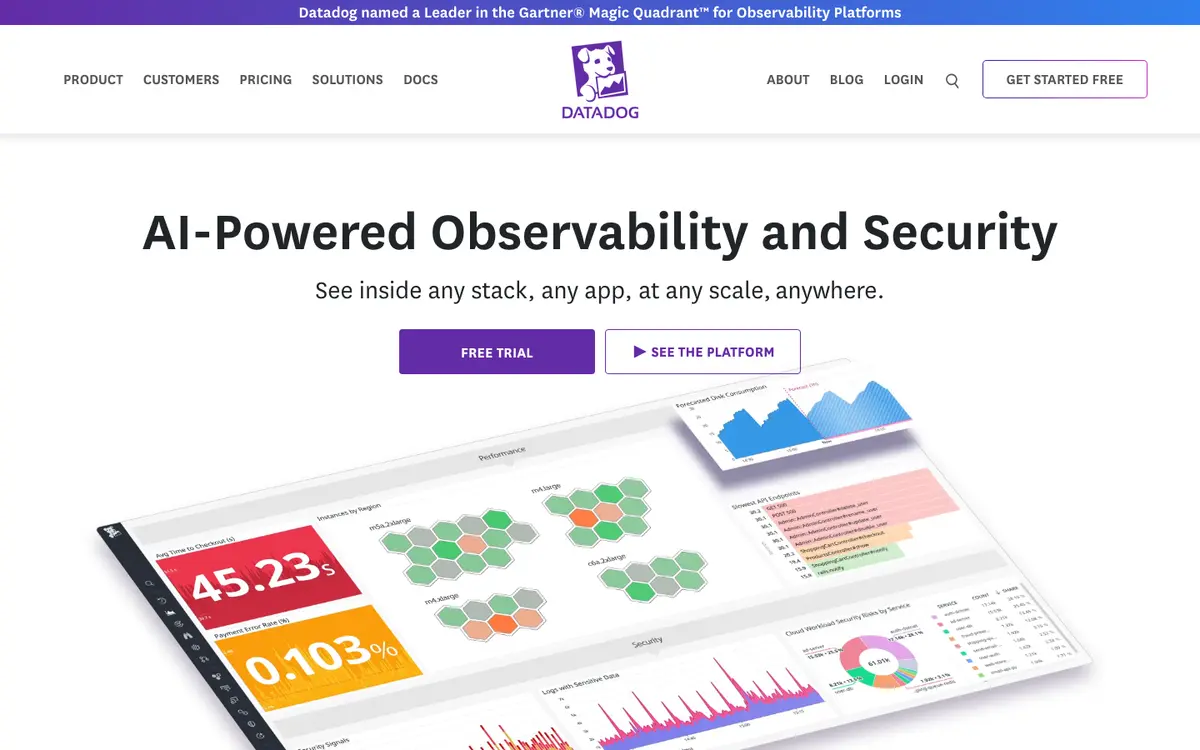
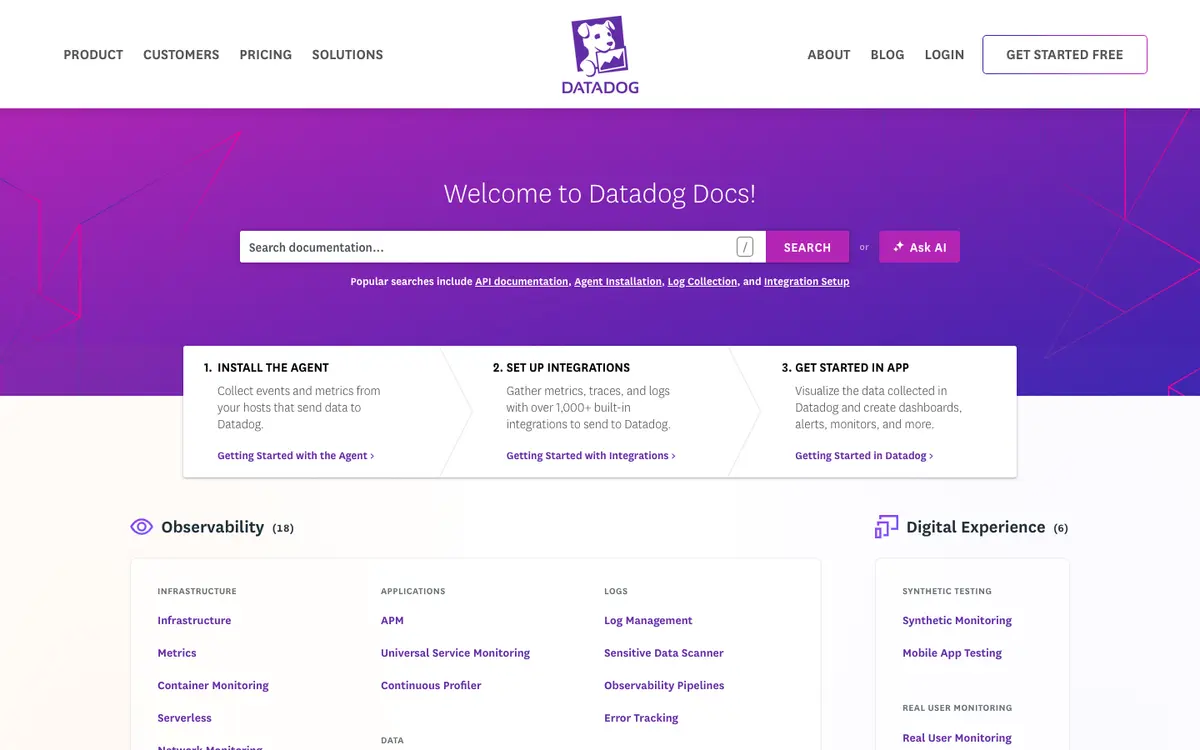
Try itExperimental
See what an agent can do with Datadog before you ever sign up. Pick a story: recorded sessions replay real probe-harness transcripts; sandboxed self-drive sessions are designed and gated (docs/TRY-IT.md).
$datadog-ci versionrecorded session — replayed, not liveVerified integrations
Connections to other tracked products — hover a chip for the verbatim evidence quote behind it.










By theme — the product's score on each story themeBy theme
Agenticness — how well agents can access and operate the productAgenticnessevidence →
How well agents can access and operate the product
Ai assist — stories about ai assist in this arenaAi assistevidence →
Stories about ai assist in this arena
Alerting slos — stories about alerting slos in this arenaAlerting slosevidence →
Stories about alerting slos in this arena
Automation depth — how much of the product can run unattendedAutomation depthevidence →
How much of the product can run unattended
Cost sampling — stories about cost sampling in this arenaCost samplingevidence →
Stories about cost sampling in this arena
Dashboards as code — stories about dashboards as code in this arenaDashboards as codeevidence →
Stories about dashboards as code in this arena
Deployment openness — stories about deployment openness in this arenaDeployment opennessevidence →
Stories about deployment openness in this arena
Incident response — stories about incident response in this arenaIncident responseevidence →
Stories about incident response in this arena
Openness — open source, data portability, and self-hosting storiesOpennessevidence →
Open source, data portability, and self-hosting stories
Otel standards — stories about otel standards in this arenaOtel standardsevidence →
Stories about otel standards in this arena
Privacy posture — data-handling and privacy storiesPrivacy postureevidence →
Data-handling and privacy stories
Query analytics — stories about query analytics in this arenaQuery analyticsevidence →
Stories about query analytics in this arena
Telemetry unified — stories about telemetry unified in this arenaTelemetry unifiedevidence →
Stories about telemetry unified in this arena
Story verdicts — every judged story with its evidenceStory verdicts
Follow the green: where the map greys out is where Datadog stops today. ✓ full · ~ partial · ! disputed · — none · n/a not applicable.
Agenticness — how well agents can access and operate the productAgenticness
How well agents can access and operate the product
API surface
Drive the product through a documented public API
✓9/10
unlocks → Webhooks · Scoped API keys · API sandbox · Full data export
Subscribe to events via webhooks
—–
Build against official SDKs
~5/10
Issue scoped/least-privilege API credentials for an agent
—0/10
Connect an agent via an official MCP server
✓8/10
Download a machine-readable API spec (OpenAPI or equivalent)
~4/10
unlocks → Interactive API docs
Rely on versioned APIs with a documented deprecation policy
~4/10
Test against a sandbox environment without touching production data
—–
Explore an interactive API reference with runnable examples
—0/10
Docs for agents
Point an agent at llms.txt or agent-oriented docs
✓8/10
Agentic features
Delegate tasks to a built-in AI assistant inside the product
~5/10
unlocks → MCP client
Operate the product with natural-language commands
~5/10
Plug MCP servers into this product so it can use their tools
—0/10
Get AI-generated insights and suggestions from my data inside the product
✓7/10
Set up automations that run autonomously in the background
~5/10
Ai assist — stories about ai assist in this arenaAi assist
Stories about ai assist in this arena
Alerting slos — stories about alerting slos in this arenaAlerting slos
Stories about alerting slos in this arena
Automation depth — how much of the product can run unattendedAutomation depth
How much of the product can run unattended
Cost sampling — stories about cost sampling in this arenaCost sampling
Stories about cost sampling in this arena
Dashboards as code — stories about dashboards as code in this arenaDashboards as code
Stories about dashboards as code in this arena
Deployment openness — stories about deployment openness in this arenaDeployment openness
Stories about deployment openness in this arena
Incident response — stories about incident response in this arenaIncident response
Stories about incident response in this arena
Openness — open source, data portability, and self-hosting storiesOpenness
Open source, data portability, and self-hosting stories
Otel standards — stories about otel standards in this arenaOtel standards
Stories about otel standards in this arena
Privacy posture — data-handling and privacy storiesPrivacy posture
Data-handling and privacy stories
Query analytics — stories about query analytics in this arenaQuery analytics
Stories about query analytics in this arena
Telemetry unified — stories about telemetry unified in this arenaTelemetry unified
Stories about telemetry unified in this arena
Jump from a trace span to its correlated logs and metrics to debug a request end to end
✓7/10
Instrument hosts, containers, Kubernetes, and cloud services through vendor-maintained agents and integrations
✓9/10
Collect metrics, logs, and traces in one platform and pivot between them with shared context
✓8/10
Sorted by importance (agentic first) (high → low) · 54/54 stories · click a row’s chevron for the rationale and evidence
Drive the product through a documented public API G Agent access | ai-native user | Agenticness — how well agents can access and operate the productAgenticness | 3 | full | 9/10 | Tprobed | |
Connect an agent via an official MCP server G Agent access | ai-native user | Agenticness — how well agents can access and operate the productAgenticness | 3 | full | 8/10 | Tprobed | |
Delegate tasks to a built-in AI assistant inside the product G Agentic features | ai-native user | Agenticness — how well agents can access and operate the productAgenticness | 3 | partial | 5/10 | Cclaimed | |
Plug MCP servers into this product so it can use their tools G Agent access | ai-native user | Agenticness — how well agents can access and operate the productAgenticness | 3 | none | 0/10 | ||
Point an agent at llms.txt or agent-oriented docs G Agent access | ai-native user | Agenticness — how well agents can access and operate the productAgenticness | 2 | full | 8/10 | Tprobed | |
Use an official CLI G Agent access | ai-native user | Agenticness — how well agents can access and operate the productAgenticness | 2 | full | 8/10 | Tprobed | |
Get AI-generated insights and suggestions from my data inside the product G Agentic features | ai-native user | Agenticness — how well agents can access and operate the productAgenticness | 2 | full | 7/10 | Cclaimed | |
Run the product headlessly / in CI for automation G Agent access | ai-native user | Agenticness — how well agents can access and operate the productAgenticness | 2 | partial | 6/10 | Tprobed | |
Build against official SDKs G Agent access | ai-native user | Agenticness — how well agents can access and operate the productAgenticness | 2 | partial | 5/10 | Tprobed | |
Operate the product with natural-language commands G Agentic features | ai-native user | Agenticness — how well agents can access and operate the productAgenticness | 2 | partial | 5/10 | Tprobed | |
Set up automations that run autonomously in the background G Agentic features | ai-native user | Agenticness — how well agents can access and operate the productAgenticness | 2 | partial | 5/10 | Cclaimed | |
Download a machine-readable API spec (OpenAPI or equivalent) G Api quality | ai-native user | Agenticness — how well agents can access and operate the productAgenticness | 2 | partial | 4/10 | Tprobed | |
Rely on versioned APIs with a documented deprecation policy G Api quality | ai-native user | Agenticness — how well agents can access and operate the productAgenticness | 2 | partial | 4/10 | Cclaimed | |
Explore an interactive API reference with runnable examples G Api quality | ai-native user | Agenticness — how well agents can access and operate the productAgenticness | 2 | none | 0/10 | ||
Issue scoped/least-privilege API credentials for an agent G Agent access | ai-native user | Agenticness — how well agents can access and operate the productAgenticness | 2 | none | 0/10 | ||
Subscribe to events via webhooks G Agent access | ai-native user | Agenticness — how well agents can access and operate the productAgenticness | 2 | none | untested | none yet | |
Test against a sandbox environment without touching production data G Api quality | ai-native user | Agenticness — how well agents can access and operate the productAgenticness | 1 | none | untested | none yet | |
Alert on any telemetry signal with routing, grouping, and silencing of notifications C Alerting | sre | Alerting slos — stories about alerting slos in this arenaAlerting slos | 3 | full | 8/10 | Xcommunity | |
Collect metrics, logs, and traces in one platform and pivot between them with shared context C Signals | sre | Telemetry unified — stories about telemetry unified in this arenaTelemetry unified | 3 | full | 8/10 | Xcommunity | |
Have an external agent query metrics, logs, and traces through documented APIs to debug production C Agent integration | ai-native user | Ai assist — stories about ai assist in this arenaAi assist | 3 | full | 8/10 | Tprobed | |
Send telemetry directly over OTLP with first-class OpenTelemetry support C Otel | developer | Otel standards — stories about otel standards in this arenaOtel standards | 3 | full | 7/10 | Cclaimed | |
Analyze telemetry ad hoc with a documented query language C Query language | developer | Query analytics — stories about query analytics in this arenaQuery analytics | 3 | partial | 6/10 | Xcommunity | |
Define rules that trigger actions automatically on events G | ai-native user | Automation depth — how much of the product can run unattendedAutomation depth | 3 | partial | 6/10 | Cclaimed | |
Have the platform's AI investigate an alert or error and propose a probable root cause C Ai investigation | ai-native user | Ai assist — stories about ai assist in this arenaAi assist | 3 | partial | 6/10 | Tprobed | |
Define dashboards and alerts as code (JSON models, Terraform, or API) and provision them repeatably C As code | developer | Dashboards as code — stories about dashboards as code in this arenaDashboards as code | 3 | partial | 5/10 | Tprobed | |
See what my observability spend is, attribute it to teams or services, and catch usage spikes before the bill C Cost | sre | Cost sampling — stories about cost sampling in this arenaCost sampling | 3 | disputed | 5/10 | Dcontradicted | |
Export all of my data in open formats and leave G | ai-native user | Openness — open source, data portability, and self-hosting storiesOpenness | 3 | none | 0/10 | ||
Prevent my data from being used to train AI models G | ai-native user | Privacy posture — data-handling and privacy storiesPrivacy posture | 3 | none | untested | none yet | |
Self-host the core product G | ai-native user | Openness — open source, data portability, and self-hosting storiesOpenness | 3 | none | untested | none yet | |
Instrument hosts, containers, Kubernetes, and cloud services through vendor-maintained agents and integrations C Instrumentation | sre | Telemetry unified — stories about telemetry unified in this arenaTelemetry unified | 2 | full | 9/10 | Xcommunity | |
Define SLOs with error budgets and burn-rate alerts C Slos | sre | Alerting slos — stories about alerting slos in this arenaAlerting slos | 2 | full | 8/10 | Cclaimed | |
Jump from a trace span to its correlated logs and metrics to debug a request end to end C Correlation | developer | Telemetry unified — stories about telemetry unified in this arenaTelemetry unified | 2 | full | 7/10 | Xcommunity | |
Build shareable dashboards with rich visualization types and template variables C Dashboards | sre | Dashboards as code — stories about dashboards as code in this arenaDashboards as code | 2 | partial | 6/10 | Xcommunity | |
Correlate regressions with deploys and configuration changes via release or change tracking C Change tracking | developer | Incident response — stories about incident response in this arenaIncident response | 2 | partial | 6/10 | Xcommunity | |
Declare and track incidents with timelines, on-call schedules, and escalation policies C Incidents | sre | Incident response — stories about incident response in this arenaIncident response | 2 | partial | 6/10 | Cclaimed | |
Do everything through the API that I can do in the UI G | ai-native user | Openness — open source, data portability, and self-hosting storiesOpenness | 2 | partial | 6/10 | Tprobed | |
Get AI-generated summaries of incidents and alert context for responders C Ai investigation | ai-native user | Ai assist — stories about ai assist in this arenaAi assist | 2 | partial | 6/10 | Cclaimed | |
Instrument once with open standards and switch backends without re-instrumenting my code C Otel | sre | Otel standards — stories about otel standards in this arenaOtel standards | 2 | partial | 6/10 | Cclaimed | |
Ask questions of my telemetry in natural language and get a real query or chart back C Ai querying | ai-native user | Ai assist — stories about ai assist in this arenaAi assist | 2 | partial | 5/10 | Tprobed | |
Group and filter by high-cardinality fields (user id, request id) without pre-aggregating or defining indexes first C Analysis | developer | Query analytics — stories about query analytics in this arenaQuery analytics | 2 | partial | 5/10 | Xcommunity | |
Perform bulk operations across many items at once G | ai-native user | Automation depth — how much of the product can run unattendedAutomation depth | 2 | partial | 4/10 | Tprobed | |
Control trace/log sampling and retention tiers to manage data volume deliberately C Sampling | developer | Cost sampling — stories about cost sampling in this arenaCost sampling | 2 | partial | 2/10 | Cclaimed | |
See application errors grouped into issues with stack traces, release tracking, and regression detection C Errors | developer | Query analytics — stories about query analytics in this arenaQuery analytics | 2 | none | 0/10 | ||
Choose where my data is stored (region/residency) G | ai-native user | Privacy posture — data-handling and privacy storiesPrivacy posture | 2 | none | untested | none yet | |
Control data retention and deletion G | ai-native user | Privacy posture — data-handling and privacy storiesPrivacy posture | 2 | none | untested | none yet | |
Opt out of telemetry and usage tracking G | ai-native user | Privacy posture — data-handling and privacy storiesPrivacy posture | 2 | none | untested | none yet | |
Point alert notifications at webhooks that trigger automated remediation or agents G Alert automation | ai-native user | Alerting slos — stories about alerting slos in this arenaAlerting slos | 2 | none | untested | none yet | |
Read the product's source under an open license G | ai-native user | Openness — open source, data portability, and self-hosting storiesOpenness | 2 | none | untested | none yet | |
Run the full observability stack self-hosted in production with documented architecture and upgrade path G Self host | sre | Deployment openness — stories about deployment openness in this arenaDeployment openness | 2 | none | untested | none yet | |
Schedule recurring jobs or workflows G | ai-native user | Automation depth — how much of the product can run unattendedAutomation depth | 2 | none | untested | none yet | |
Enable anomaly or outlier detection that surfaces problems without hand-written thresholds C Alerting | sre | Alerting slos — stories about alerting slos in this arenaAlerting slos | 1 | full | 8/10 | Cclaimed | |
Predict costs from transparent published per-signal pricing without talking to sales G Cost | sre | Cost sampling — stories about cost sampling in this arenaCost sampling | 1 | none | 0/10 | ||
Spin up a local or dev instance of the platform to test instrumentation and dashboards C Local dev | developer | Deployment openness — stories about deployment openness in this arenaDeployment openness | 1 | none | untested | none yet | |
Version, review, and roll back my automations G | ai-native user | Automation depth — how much of the product can run unattendedAutomation depth | 1 | none | untested | none yet |
Opportunities — the stories that would move this product's scores, from its own judged verdictsOpportunitiestop 8 of 40 stories with headroom
What would move Datadog’s scores — derived from its own judged verdicts, biggest headroom first. Each line quotes what the judge found missing; shipping it (or evidencing it publicly) is the fix.
Agenticness — how well agents can access and operate the productPlug MCP servers into this product so it can use their tools
nonemoves agent-readyimpact 45
Evidence only shows Datadog exposing its own official MCP server so external agents can call Datadog's tools (datadog-docs-3, datadog-probe-3) — the reverse direction of this story, which asks whether a user can plug external MCP servers into Datadog so Datadog's own AI features (e.g., Bits AI) can consume their tools.
Openness — open source, data portability, and self-hosting storiesExport all of my data in open formats and leave
nonemoves PA Scoreimpact 30
Missing: documented full-account data export/backup feature, open-format export guarantees, and any evidence of successful data portability/migration by users.
Openness — open source, data portability, and self-hosting storiesSelf-host the core product
nonemoves PA Scoreimpact 30
Datadog is a SaaS-only observability platform; no evidence of an on-premise/self-hosted core product offering exists in the pack, and its architecture (cloud dashboards, Watchdog, integrations) presumes a hosted service.
Privacy posture — data-handling and privacy storiesPrevent my data from being used to train AI models
nonemoves PA Scoreimpact 30
No evidence in the pack addresses AI-training data-usage opt-out policies or controls for Datadog's own AI features (e.g., Bits AI); this is an applicable privacy-posture question for an AI-enabled product but is unaddressed by any docs or community citations.
Agenticness — how well agents can access and operate the productIssue scoped/least-privilege API credentials for an agent
nonemoves agent-readyimpact 30
Missing: documentation on restricted/scoped API keys, role-based key permissions for AI agents, or any agent-specific credential-issuance workflow.
Agenticness — how well agents can access and operate the productSubscribe to events via webhooks
nonemoves agent-readyimpact 30
Missing: any documentation of webhook configuration, webhook payload format, or webhook-based event subscription mechanism.
Agenticness — how well agents can access and operate the productExplore an interactive API reference with runnable examples
nonemoves API qualityimpact 30
Datadog has an API Reference doc page, but there's no evidence of an interactive, runnable-example reference (e.g., embedded code sandbox, try-it-now console); the OpenAPI probe even returned 404s across candidate paths, suggesting no discoverable machine-readable spec for interactive tooling.
Agenticness — how well agents can access and operate the productDelegate tasks to a built-in AI assistant inside the product
partialq5/10moves Built-in AIimpact 22.5
Missing: detailed documentation of task-delegation capabilities and scope, and community or hands-on validation of Bits AI actually performing delegated tasks.
Showing the top 8 of 40 — every none/partial verdict in the story verdicts table is headroom.
Think a verdict is wrong? Every verdicts-table row has a Flag link — see the methodology.
Coverage map — which docs area, API section, or community source covers which judged storiesCoverage map19 surfaces · 35 covered stories
Where the cited evidence behind each covered verdict came from — the same citations the verdicts table shows, no extra judging.
API reference11 stories
- Run the product headlessly / in CI for automation
- Drive the product through a documented public API
- Build against official SDKs
- Download a machine-readable API spec (OpenAPI or equivalent)
- Rely on versioned APIs with a documented deprecation policy
- Have an external agent query metrics, logs, and traces through documented APIs to debug production
- Perform bulk operations across many items at once
- Define rules that trigger actions automatically on events
- Define dashboards and alerts as code (JSON models, Terraform, or API) and provision them repeatably
- Do everything through the API that I can do in the UI
- Analyze telemetry ad hoc with a documented query language
Mcp_server docs10 stories
- Point an agent at llms.txt or agent-oriented docs
- Connect an agent via an official MCP server
- Drive the product through a documented public API
- Build against official SDKs
- Operate the product with natural-language commands
- Have an external agent query metrics, logs, and traces through documented APIs to debug production
- Have the platform's AI investigate an alert or error and propose a probable root cause
- Ask questions of my telemetry in natural language and get a real query or chart back
- Perform bulk operations across many items at once
- Do everything through the API that I can do in the UI
Hacker News9 stories
- Alert on any telemetry signal with routing, grouping, and silencing of notifications
- See what my observability spend is, attribute it to teams or services, and catch usage spikes before the bill
- Build shareable dashboards with rich visualization types and template variables
- Correlate regressions with deploys and configuration changes via release or change tracking
- Group and filter by high-cardinality fields (user id, request id) without pre-aggregating or defining indexes first
- Analyze telemetry ad hoc with a documented query language
- Jump from a trace span to its correlated logs and metrics to debug a request end to end
- Instrument hosts, containers, Kubernetes, and cloud services through vendor-maintained agents and integrations
- Collect metrics, logs, and traces in one platform and pivot between them with shared context
Tracing docs9 stories
- Have an external agent query metrics, logs, and traces through documented APIs to debug production
- Control trace/log sampling and retention tiers to manage data volume deliberately
- Correlate regressions with deploys and configuration changes via release or change tracking
- Send telemetry directly over OTLP with first-class OpenTelemetry support
- Instrument once with open standards and switch backends without re-instrumenting my code
- Group and filter by high-cardinality fields (user id, request id) without pre-aggregating or defining indexes first
- Jump from a trace span to its correlated logs and metrics to debug a request end to end
- Instrument hosts, containers, Kubernetes, and cloud services through vendor-maintained agents and integrations
- Collect metrics, logs, and traces in one platform and pivot between them with shared context
Bits_ai docs8 stories
- Get AI-generated insights and suggestions from my data inside the product
- Set up automations that run autonomously in the background
- Delegate tasks to a built-in AI assistant inside the product
- Operate the product with natural-language commands
- Get AI-generated summaries of incidents and alert context for responders
- Have the platform's AI investigate an alert or error and propose a probable root cause
- Ask questions of my telemetry in natural language and get a real query or chart back
- Do everything through the API that I can do in the UI
Monitors docs8 stories
- Set up automations that run autonomously in the background
- Alert on any telemetry signal with routing, grouping, and silencing of notifications
- Enable anomaly or outlier detection that surfaces problems without hand-written thresholds
- Define SLOs with error budgets and burn-rate alerts
- Define rules that trigger actions automatically on events
- Define dashboards and alerts as code (JSON models, Terraform, or API) and provision them repeatably
- Correlate regressions with deploys and configuration changes via release or change tracking
- Declare and track incidents with timelines, on-call schedules, and escalation policies
GitHub README7 stories
- Run the product headlessly / in CI for automation
- Use an official CLI
- Drive the product through a documented public API
- Build against official SDKs
- Perform bulk operations across many items at once
- Define dashboards and alerts as code (JSON models, Terraform, or API) and provision them repeatably
- Do everything through the API that I can do in the UI
Watchdog docs7 stories
- Get AI-generated insights and suggestions from my data inside the product
- Set up automations that run autonomously in the background
- Have the platform's AI investigate an alert or error and propose a probable root cause
- Alert on any telemetry signal with routing, grouping, and silencing of notifications
- Enable anomaly or outlier detection that surfaces problems without hand-written thresholds
- Define rules that trigger actions automatically on events
- Do everything through the API that I can do in the UI
Logs docs6 stories
- Have an external agent query metrics, logs, and traces through documented APIs to debug production
- Control trace/log sampling and retention tiers to manage data volume deliberately
- Group and filter by high-cardinality fields (user id, request id) without pre-aggregating or defining indexes first
- Analyze telemetry ad hoc with a documented query language
- Jump from a trace span to its correlated logs and metrics to debug a request end to end
- Collect metrics, logs, and traces in one platform and pivot between them with shared context
Opentelemetry docs4 stories
Dashboards docs3 stories
Incident_response docs3 stories
Service_level_objectives docs3 stories
OpenAPI spec2 stories
docs.datadoghq.com2 stories
Product docs2 stories
Cloud_cost_management docs1 story
Probe proofs — replayable recordings from the probe harnessProbe proofs
Replayable recordings from our probe harness — see the Prove-It protocol to submit one.
$datadog-ci versionreproduced$ datadog-ci version v5.23.0
$curl -si -X POST https://mcp.datadoghq.com/api/unstable/mcp-server/mcp -H 'Content-Type: application/json' -d '<jsonrpc initialize>'reproduced$ curl -si -X POST https://mcp.datadoghq.com/api/unstable/mcp-server/mcp -H 'Content-Type: application/json' -d '<jsonrpc initialize>'
HTTP/2 401
x-content-type-options: nosniff
strict-transport-security: max-age=31536000; includeSubDomains; preload
content-type: application/json
content-length: 27
date: Sat, 05 Sep 2026 01:11:29 GMT
{"errors":["Unauthorized"]}
Claims vs evidence — vendor claims reconciled against independent verdictsClaims vs evidence
7 of 16 testable claims verified · 2 contradicted → integrity 19/100
25 distinct capability claims found in Datadog’s own claimed-docs/GitHub materials, reconciled against our judge’s independent verdicts.
7
Verified
7
Unverified
2
Contradicted
20
Undersold
Verified (9)
“Provides application performance monitoring (APM) to trace requests across distributed services”
Jump from a trace span to its correlated logs and metrics to debug a request end to endfullproof ↗
“Provides application performance monitoring (APM) to trace requests across distributed services”
Collect metrics, logs, and traces in one platform and pivot between them with shared contextfullproof ↗
“Offers an official MCP server so AI agents can connect and use Datadog tools”
“Bits AI is a built-in AI assistant that can analyze data, summarize incidents, and suggest root causes”
Have the platform's AI investigate an alert or error and propose a probable root causepartialproof ↗
“Database Monitoring gives visibility into query performance and database health”
Instrument hosts, containers, Kubernetes, and cloud services through vendor-maintained agents and integrationsfullproof ↗
“Monitors let you set alerts on any telemetry signal with configurable conditions”
Alert on any telemetry signal with routing, grouping, and silencing of notificationsfullproof ↗
“Dashboards feature allows building shareable, customizable visualizations”
Build shareable dashboards with rich visualization types and template variablespartialproof ↗
“Log Management centralizes log collection, search, and analysis”
Collect metrics, logs, and traces in one platform and pivot between them with shared contextfullproof ↗
“GPU Monitoring tracks GPU utilization and performance metrics”
Instrument hosts, containers, Kubernetes, and cloud services through vendor-maintained agents and integrationsfullproof ↗
Unverified (7)
“Supports ingesting telemetry via OpenTelemetry standards”
Send telemetry directly over OTLP with first-class OpenTelemetry supportfullproof ↗
“Supports ingesting telemetry via OpenTelemetry standards”
Instrument once with open standards and switch backends without re-instrumenting my codepartialproof ↗
“Bits AI is a built-in AI assistant that can analyze data, summarize incidents, and suggest root causes”
Delegate tasks to a built-in AI assistant inside the productpartialproof ↗
“Bits AI is a built-in AI assistant that can analyze data, summarize incidents, and suggest root causes”
Get AI-generated summaries of incidents and alert context for responderspartialproof ↗
“Service Level Objectives feature lets you define SLOs and track error budgets”
Define SLOs with error budgets and burn-rate alertsfullproof ↗
“Incident Management supports declaring, tracking, and resolving incidents”
Declare and track incidents with timelines, on-call schedules, and escalation policiespartialproof ↗
“Watchdog automatically detects anomalies and outliers without manual thresholds”
Enable anomaly or outlier detection that surfaces problems without hand-written thresholdsfullproof ↗
Contradicted (2)
“Cloud Cost Management gives visibility into and attribution of cloud/observability spend”
See what my observability spend is, attribute it to teams or services, and catch usage spikes before the billdisputedproof ↗
“Publishes an API reference documenting programmatic access to Datadog features”
Explore an interactive API reference with runnable examplesnoneproof ↗
Undersold (20)
Point an agent at llms.txt or agent-oriented docsfullproof ↗
Run the product headlessly / in CI for automationpartialproof ↗
Drive the product through a documented public APIfullproof ↗
Get AI-generated insights and suggestions from my data inside the productfullproof ↗
Set up automations that run autonomously in the backgroundpartialproof ↗
Operate the product with natural-language commandspartialproof ↗
Download a machine-readable API spec (OpenAPI or equivalent)partialproof ↗
Rely on versioned APIs with a documented deprecation policypartialproof ↗
Have an external agent query metrics, logs, and traces through documented APIs to debug productionfullproof ↗
Ask questions of my telemetry in natural language and get a real query or chart backpartialproof ↗
Perform bulk operations across many items at oncepartialproof ↗
Define rules that trigger actions automatically on eventspartialproof ↗
Control trace/log sampling and retention tiers to manage data volume deliberatelypartialproof ↗
Define dashboards and alerts as code (JSON models, Terraform, or API) and provision them repeatablypartialproof ↗
Correlate regressions with deploys and configuration changes via release or change trackingpartialproof ↗
Do everything through the API that I can do in the UIpartialproof ↗
Group and filter by high-cardinality fields (user id, request id) without pre-aggregating or defining indexes firstpartialproof ↗
Analyze telemetry ad hoc with a documented query languagepartialproof ↗
Claims outside our story set (11)
Real capability claims found in Datadog’s own materials, but no story in this arena’s taxonomy covers them yet — that’s feedback on the taxonomy, not a mark against the product.
“Static Code Analysis (SAST) scans source code for security vulnerabilities”
source ↗“Software Composition Analysis identifies vulnerabilities in open-source dependencies”
source ↗“Dynamic Instrumentation lets you add logs/traces to running code without redeploying”
source ↗“Continuous Profiler provides always-on code-level performance profiling”
source ↗“Kubernetes Autoscaling automatically scales Kubernetes workloads based on metrics”
source ↗“Cloud Security Posture Management scans cloud configurations for misconfigurations and risks”
source ↗“Sensitive Data Scanner detects and redacts sensitive data in telemetry”
source ↗“Audit Trail records user and system actions for compliance and auditing”
source ↗“Data Streams Monitoring tracks health and latency of message queues/streaming pipelines”
source ↗“CI Visibility tracks CI pipeline performance, test results, and flaky tests”
source ↗“Feature Flags feature lets teams manage and roll out feature flags”
source ↗
Business model
Modular SKU pricing: per-host infrastructure/APM subscriptions plus usage-based ingestion for logs and other signals; free tier covers up to 5 hosts of core infrastructure monitoring.
pricing ↗Score trend
How this product’s scores have moved as evidence and verdicts are re-derived — a point per change, not per day.
Try Experimental
Run it in the microterminal →Recorded agent sessions — and a live MCP handshake where the vendor ships one.
Flag
⚑ Flag a verdictThink a verdict is wrong? Opens a prefilled GitHub issue — or use the ⚑ next to any verdict above.
For agents
Agent surface uptime MCP 100% · llms.txt 100% (30d, checked every 6h since Sep 8 '26)